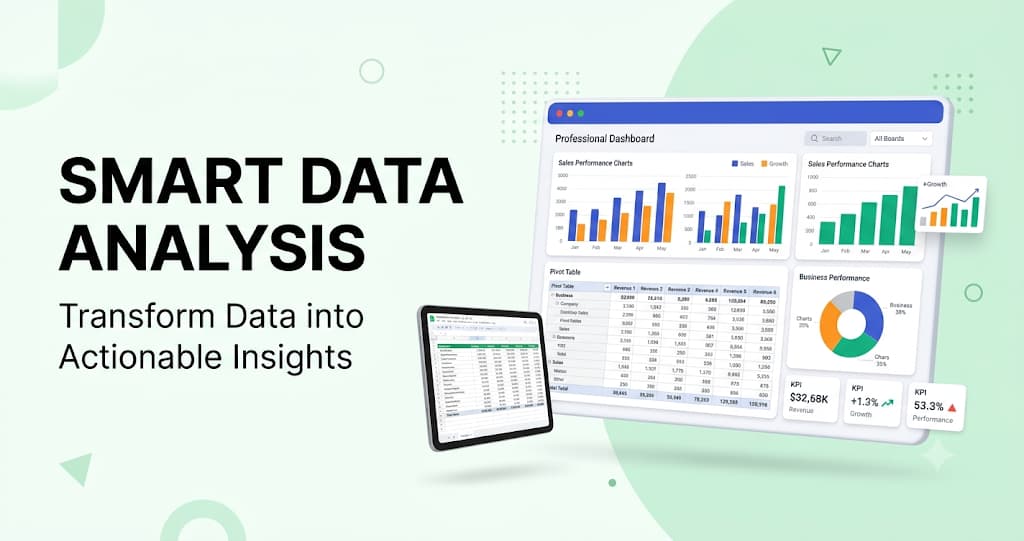
Excel Data Analysis in Phagwara
Learn Excel Data Analysis in Phagwara. Master advanced formulas, Pivot Tables, dashboards, data cleaning and MIS reporting through practical training.
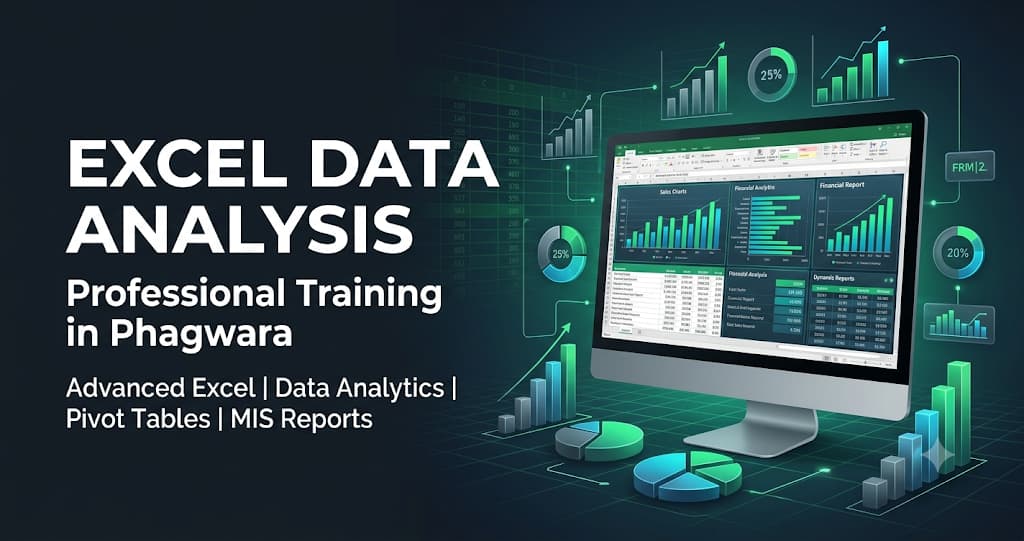
Excel Data Analysis in Phagwara – Learn Advanced Excel, Data Management and Professional Reporting Skills
Excel Data Analysis is an important skill used in businesses, offices, accounting departments, educational institutions, and corporate environments. Microsoft Excel helps individuals organise information, manage large datasets, calculate business figures, prepare reports, and analyse data for better decision-making. From maintaining sales records and tracking expenses to creating professional dashboards and generating MIS reports, Excel plays an important role in everyday business operations.
Excel Data Analysis in Phagwara focuses on developing practical knowledge of advanced Excel functions, data cleaning, sorting and filtering, lookup formulas, Pivot Tables, charts, dashboards, and professional reporting techniques.
Excel Data Analysis training in Phagwara is suitable for school students, college students, beginners, freshers, job seekers, accountants, office employees, computer learners, and working professionals who want to improve their spreadsheet management and data analysis skills. The training focuses on understanding spreadsheet structures, organising information, applying formulas, analysing datasets, preparing reports, and presenting business information effectively.
Understanding Excel Data Analysis Fundamentals
The training introduces learners to Microsoft Excel and its importance in academic, business, and professional environments. Students understand how spreadsheets are used to store information, perform calculations, manage records, and prepare structured reports.
Topics include workbook and worksheet management, rows and columns, cells and ranges, data entry, formatting, number formats, basic calculations, cell references, and spreadsheet organisation. These fundamentals help learners understand how Excel is used for managing and analysing information.
Advanced Excel Formulas and Functions
Excel formulas and functions help users perform calculations, process information, and analyse large datasets efficiently. Learners understand how to apply different functions to solve practical business and reporting problems.
The training covers:
Understanding mathematical and statistical functions
Using SUM, AVERAGE, MIN, and MAX
Applying IF and nested IF functions
Working with SUMIF, SUMIFS, COUNTIF, and COUNTIFS
Understanding VLOOKUP, HLOOKUP, and XLOOKUP
Using INDEX and MATCH functions
Applying IFERROR for handling formula errors
Working with text and date functions
Understanding absolute and relative cell references
These skills help learners perform calculations, retrieve information, compare records, and automate spreadsheet tasks.
Data Cleaning, Sorting and Filtering
Data cleaning is an important part of data analysis because accurate information helps produce meaningful reports. Students learn how to organise raw datasets, identify errors, and prepare information for analysis.
Topics include removing duplicate records, correcting formatting issues, handling missing values, using text-to-columns, applying data validation, sorting information, filtering specific records, and organising large spreadsheets.
These techniques help learners maintain accurate datasets and improve the quality of their reports.
Pivot Tables, Charts and Data Visualisation
Pivot Tables help users summarise and analyse large amounts of spreadsheet information without manually calculating every result. Learners understand how to create summaries, compare business figures, and identify useful patterns in datasets.
The training introduces:
Creating and managing Pivot Tables
Grouping and summarising information
Analysing sales and expense records
Creating Pivot Charts
Using slicers and interactive filters
Preparing comparison charts and graphs
Understanding data trends and performance
Presenting information through visual reports
These skills help learners convert raw spreadsheet data into meaningful summaries and professional presentations.
Excel Dashboards and MIS Reporting
Excel dashboards and MIS reports are commonly used by businesses to monitor performance, track activities, and support management decisions. Students learn how to organise business information and present important figures through structured reports.
Topics include preparing daily, weekly, and monthly reports, creating sales performance summaries, tracking employee attendance, preparing inventory reports, designing interactive dashboards, using charts and conditional formatting, and presenting key performance indicators.
Learners understand how Excel dashboards can help businesses monitor sales, expenses, productivity, and operational performance.
Power Query and Advanced Data Management
Power Query helps users import, clean, transform, and combine information from different data sources. Learners are introduced to practical data preparation techniques that reduce repetitive manual work.
The training covers importing data from Excel files, cleaning and transforming datasets, removing unnecessary columns, combining tables, changing data types, and refreshing prepared reports.
These concepts provide learners with an understanding of modern spreadsheet-based data management and reporting workflows.
Practical Excel Data Analysis Exercises and Projects
Hands-on practice helps students understand how Excel is used in real-world business situations. Learners work on different spreadsheet exercises and sample datasets to improve their formula application, data management, reporting, and analytical skills.
Practical activities may include:
Preparing sales and revenue analysis reports
Creating employee attendance sheets
Managing business expenses and financial records
Preparing inventory and stock management sheets
Using lookup formulas to retrieve information
Cleaning and organising large datasets
Creating Pivot Tables and Pivot Charts
Preparing monthly MIS reports
Designing interactive Excel dashboards
Analysing product-wise and month-wise sales performance
Creating charts and visual data summaries
Preparing professional business reporting sheets
These activities help learners develop confidence in handling spreadsheet data and preparing useful reports for different business requirements.
Who Can Join Excel Data Analysis Training in Phagwara?
Excel Data Analysis training in Phagwara is suitable for anyone interested in developing spreadsheet management and data analysis skills. School and college students can learn practical Excel applications, while beginners can understand how to work with business datasets and spreadsheet functions.
Freshers, job seekers, accountants, MIS executives, office employees, computer operators, business owners, and working professionals can also benefit from learning advanced Excel and reporting techniques. Individuals preparing for office administration, accounting, data management, and reporting responsibilities can improve their practical computer skills.
Basic computer knowledge can be helpful, but beginners can learn Excel concepts step by step.
Benefits of Learning Excel Data Analysis Skills
Learning Excel Data Analysis helps individuals develop better spreadsheet management, numerical analysis, data organisation, and reporting skills. These abilities are useful for handling business records, preparing financial summaries, analysing sales performance, and presenting information professionally.
Professional Excel knowledge can be useful in accounting, office administration, business operations, MIS reporting, sales management, inventory management, and data-related roles. It also provides a foundation for exploring advanced data analytics tools and technologies.
Why Choose Practical Excel Data Analysis Training in Phagwara?
Practical training helps learners understand how Excel is used in real-world business and office environments. The learning approach focuses on advanced formulas, data cleaning, Pivot Tables, charts, dashboards, MIS reporting, and practical spreadsheet exercises.
Students get opportunities to work with sample datasets, perform calculations, organise information, create reports, and analyse business figures. The focus is on developing useful Excel and data analysis skills through practical activities rather than learning spreadsheet concepts without application.
Enrol in Excel Data Analysis Training in Phagwara
Excel Data Analysis is a valuable skill for students, freshers, job seekers, accountants, office employees, and individuals interested in improving their computer and reporting abilities. If you want to learn advanced Excel formulas, data cleaning, Pivot Tables, dashboards, MIS reporting, and professional data management techniques, Excel Data Analysis training in Phagwara can help you develop practical knowledge and build a strong foundation for future academic and professional opportunities.