

E-commerce Sales Analysis
Analyze e-commerce sales data to identify top-selling products, revenue trends, customer behavior, and business performance using Excel and Power BI.
- Excel
- Power BI
Learn data analytics using Excel, SQL, Python, and Power BI. Develop practical skills in data cleaning, visualization, reporting, and insights to prepare for career opportunities.

Admissions open
Free demo class & counselling
Session slots
The Certificate Course in Data Analytics is designed to equip students, graduates, and working professionals with practical skills to collect, clean, analyze, and visualize data. Learn industry-relevant tools, including Microsoft Excel, SQL, Python, and Power BI, through structured training and hands-on exercises. Develop a strong foundation in data analysis, database querying, statistical interpretation, and interactive dashboard creation. Gain practical experience transforming raw datasets into meaningful insights that support business decisions and improve organizational performance. Throughout the course, work on real-world inspired projects involving sales analysis, customer insights, business reporting, and data visualization. Build analytical thinking, problem-solving, and technical skills that can help prepare you for entry-level data analytics opportunities. Whether you are a beginner exploring a career in analytics or a professional looking to strengthen your technical abilities, this course provides a structured starting point for developing valuable data analytics skills.
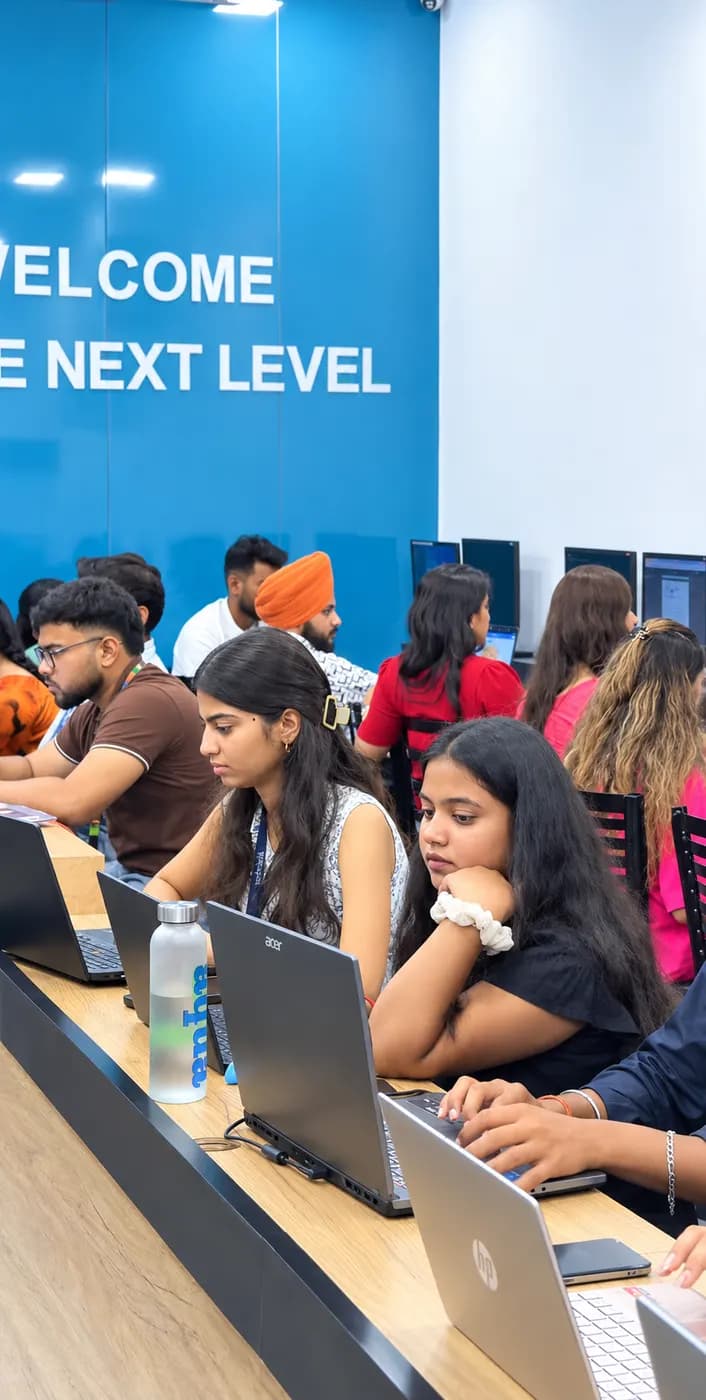
Analyze e-commerce sales data to identify top-selling products, revenue trends, customer behavior, and business performance using Excel and Power BI.
Use SQL queries, joins, filtering, and aggregation to analyze customer records, purchasing patterns, and sales performance from a structured database.
Clean and transform datasets using Python and Pandas, handle missing values, identify trends, and generate meaningful insights through exploratory data analysis.
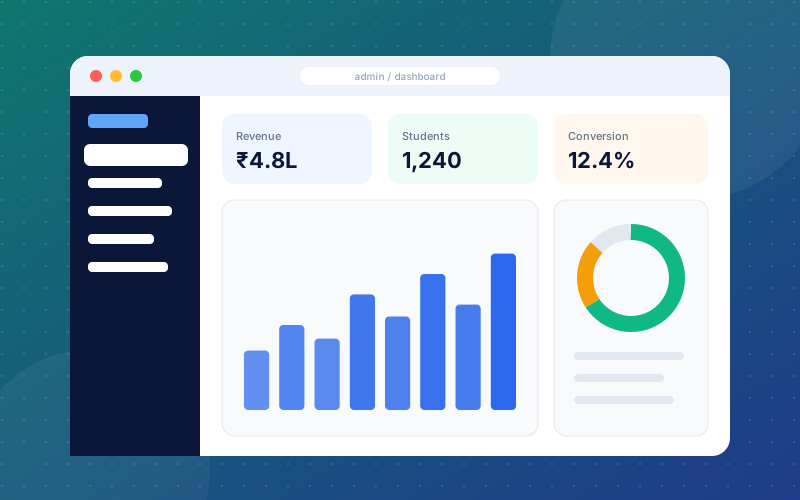
Build an interactive Power BI dashboard featuring key performance indicators, sales trends, category comparisons, and regional performance to support data-driven decisions.
The working loop
Every project moves through the same loop: understand the brief, build with guidance, then explain the decisions behind your work.
Learn the fundamentals of data analytics, understand the project requirements, and identify the questions the data needs to answer.
E-commerce Sales Analysis
Gather datasets from spreadsheets, databases, and other structured sources to prepare for analysis.
SQL Customer Database Analysis
Use Excel, SQL, and Python to organize data, handle missing values, remove inconsistencies, and prepare reliable datasets.
Python Data Analysis
Apply analytical techniques and basic statistics to discover patterns, identify trends, and generate meaningful insights.
Interactive Business Dashboard
Build interactive dashboards and clear reports using Power BI and Excel to communicate findings effectively.
Complete a practical data analytics project, explain your findings, and showcase your work in a portfolio for future career opportunities.
There are many places to learn this in Phagwara and the brochure syllabus looks similar at all of them. What differs is who teaches, whether you ever touch real work, and whether anyone picks up the phone after you have paid. techcadd has trained students across Punjab since 2016 on the same model: small batches, working practitioners as trainers, client projects as coursework.
Learn from industry-focused trainers who connect classroom concepts with practical applications, data analytics workflows, and real-world business challenges.
Practice with Excel, SQL, Python, and Power BI through guided exercises and practical projects that help you apply what you learn.
Develop practical knowledge of widely used analytics tools, data cleaning techniques, database queries, and interactive dashboard creation.
Build analytical thinking, problem-solving, reporting, and data visualization skills relevant to entry-level analytics and business intelligence roles.
Start with the fundamentals and gradually progress to data analysis and visualization, making the course suitable for learners with basic computer knowledge.
IT companies, banks, educational institutions, e-commerce businesses, and regional industries around Phagwara, Jalandhar, and Ludhiana hire data-skilled professionals for reporting, business analysis, and data-driven decision-making.
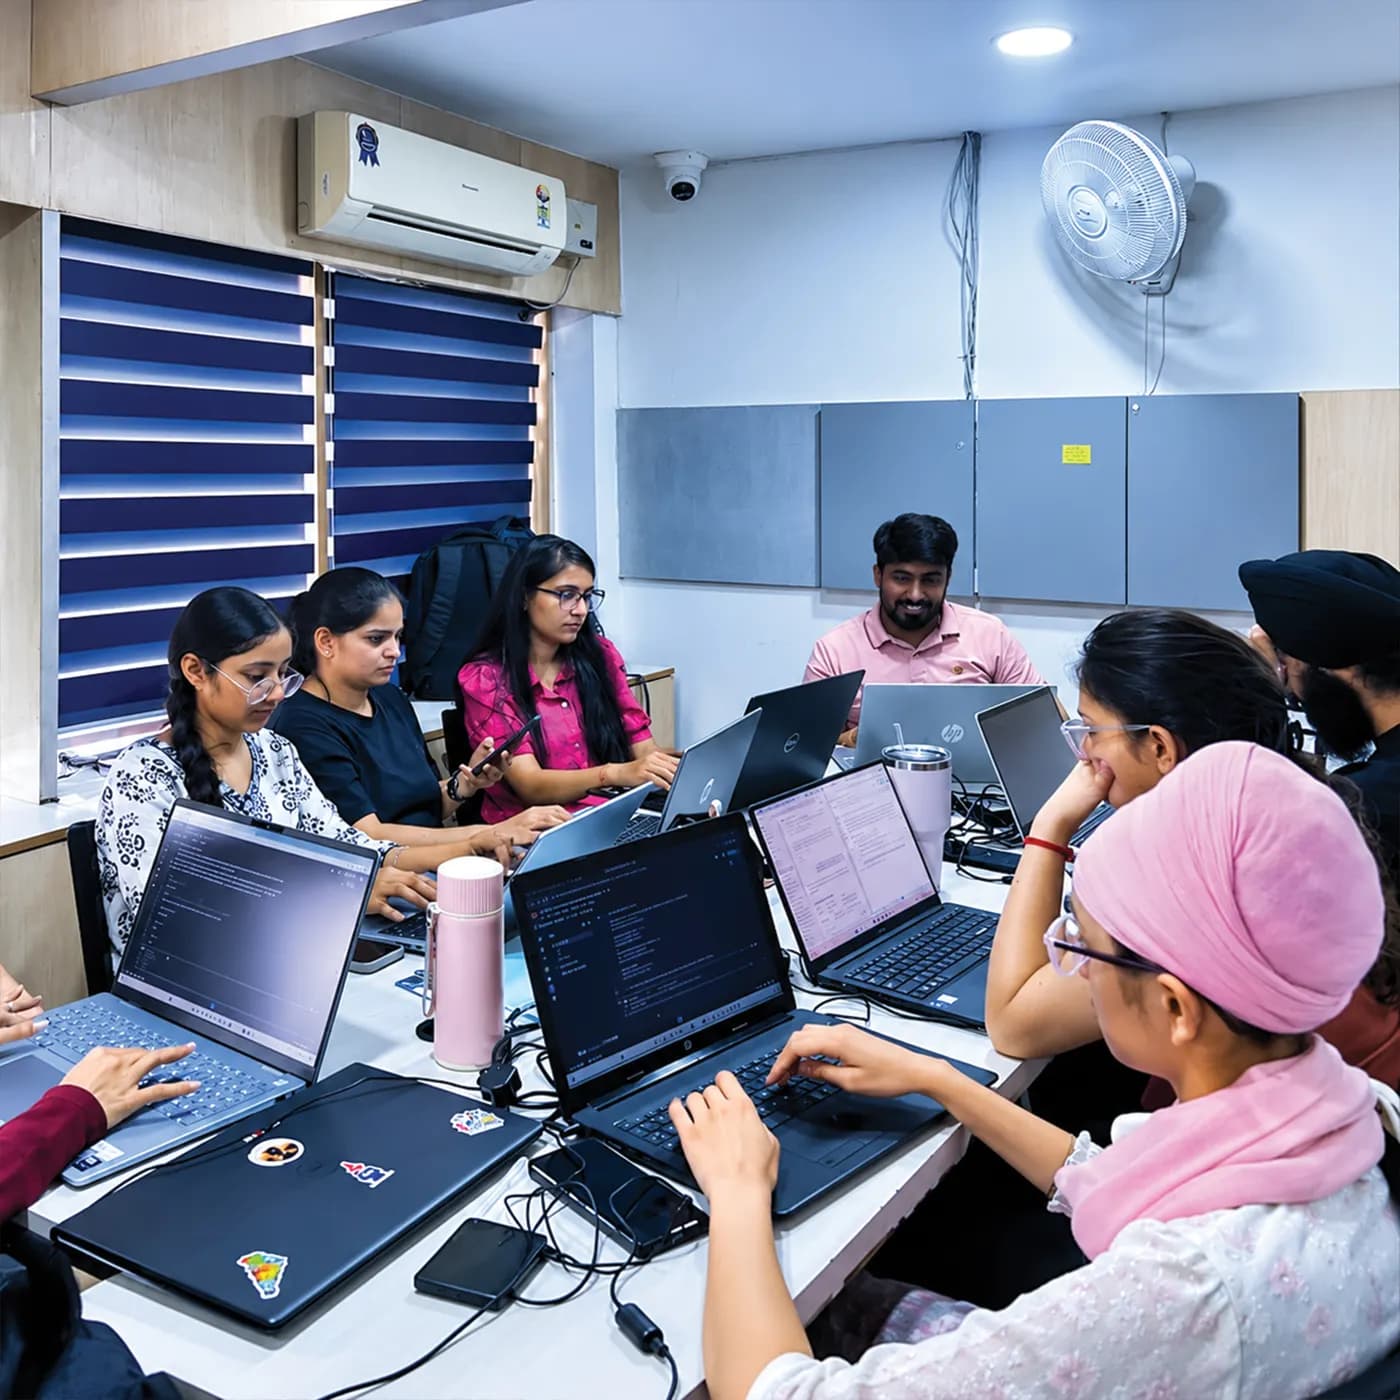
Build skills that hold up beyond the classroom.
What separates this from a playlist of tutorials is supervision on real work. From the second half of the course you build on live client projects with a trainer beside you, make decisions that have consequences, and correct them the following week. That loop is the skill. No employer in Phagwara will take your word for it without work they can inspect.
Be realistic about the money. A fresher who finishes with a working portfolio starts near the bottom of the band and moves quickly; someone who finishes with a certificate and nothing to show does not. The difference is entirely what you built.
The alternative is what most people try first: free videos, a cheap online course, six months of drifting, and knowledge you cannot demonstrate. A structured programme with live projects, a mentor who corrects you, an internship letter and a placement cell that actually calls employers is the difference between knowing the subject and being hired to do it.
Students reach the Phagwara centre from Banga, Nakodar, Kartarpur and the university belt, and the weekend batch exists so a job or a degree does not have to be paused to attend.
Complete 2–3 practical data analytics projects to demonstrate your skills in interviews and showcase your work to potential employers.
Learn Microsoft Excel, SQL, Python, and Power BI to develop practical skills in data analysis, database queries, and interactive dashboard creation.
Practice data cleaning, data transformation, statistical analysis, and visualization using structured datasets and real-world inspired business scenarios.
Build analytical thinking, problem-solving, and reporting skills that can help prepare you for entry-level data analytics and business intelligence roles.
Create professional dashboards and reports using Power BI to present key performance indicators, business trends, and actionable insights.
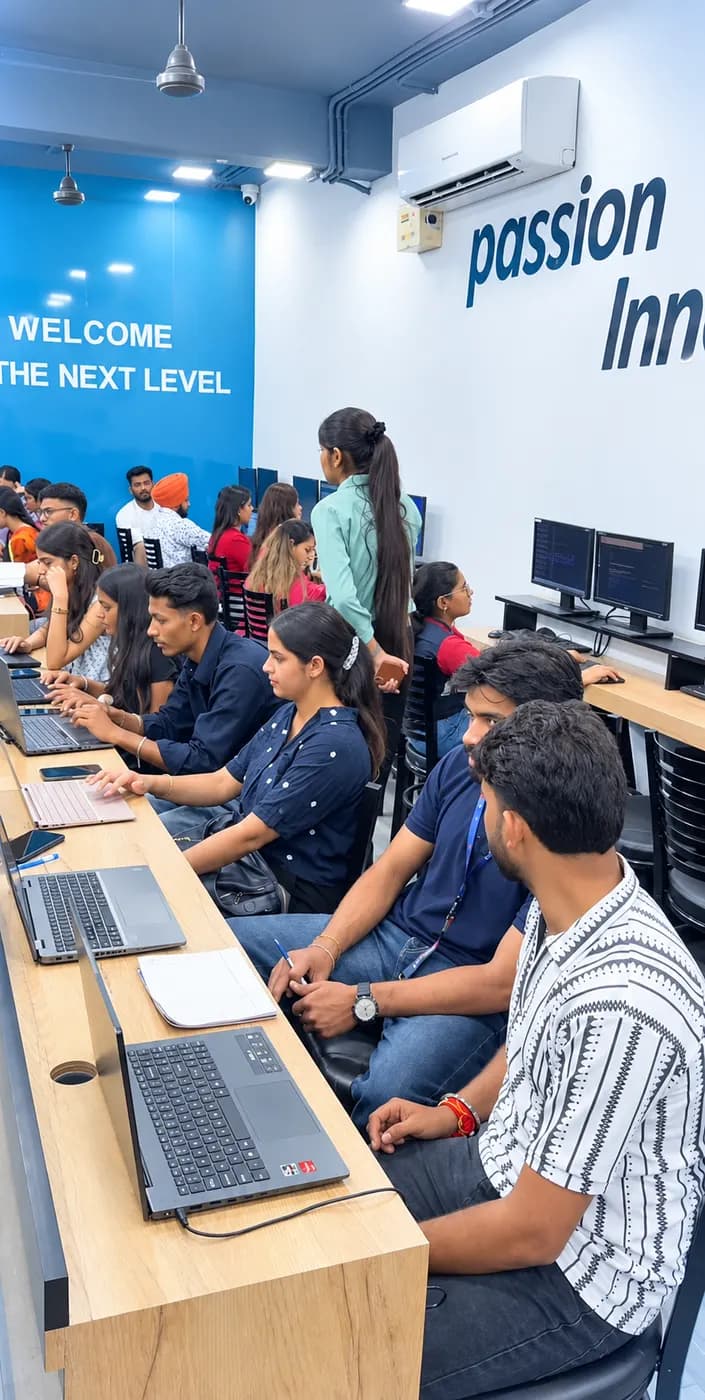
The Certificate Course in Data Analytics course is built for people at six different starting points, and the batch is deliberately mixed. What matters far more than your background is turning up consistently and finishing what each module asks you to build.
Students who want to build practical data analytics skills and explore technology-driven career opportunities.
Students and graduates seeking hands-on training and a structured pathway toward entry-level data analytics roles.
Learners who want to strengthen their technical skills in Excel, SQL, Python, and Power BI.
Students interested in business reporting, financial data analysis, data visualization, and informed decision-making.
Professionals looking to upgrade their analytical abilities, automate reporting tasks, and make better use of data at work.
Individuals with basic computer knowledge who want to learn data analytics from the fundamentals and develop practical project experience.
The toolchain behind the craft
Everything below is installed on the lab machines and used on live client work, not shown once in a slide and forgotten.
Complete the course with a portfolio of live projects and receive an industry-recognised certificate, plus a documented internship letter accepted by Punjab universities.
Recognised by employers across Punjab and beyond
Based on real client work, not a simulation
Live work you can show in any interview
CV review, mock interviews and hiring drives
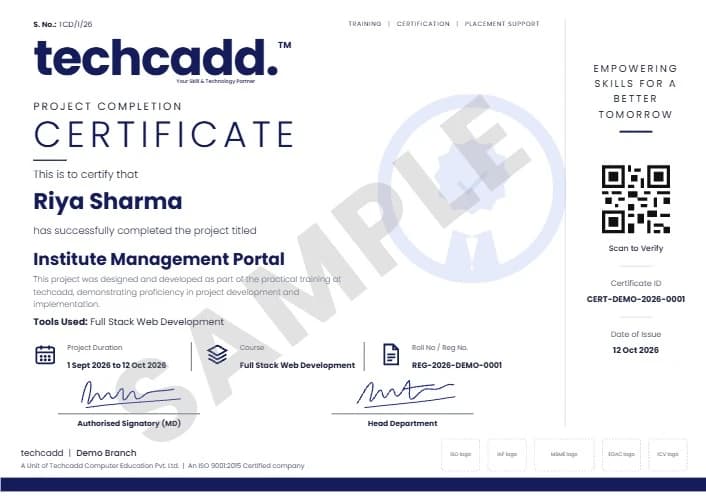
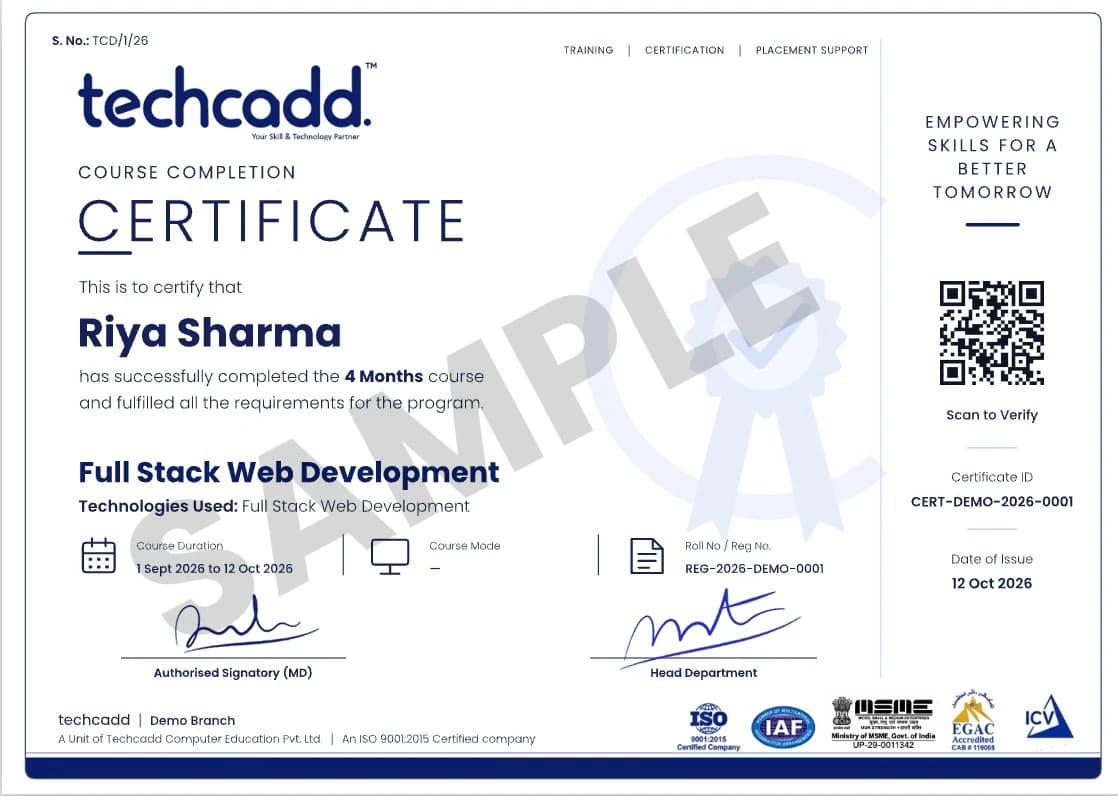
Two certificates on completion — the course certificate and a separate capstone project certificate.
The roles this opens, what they pay in Punjab and beyond, and who is hiring for them — drawn from published job-market listings on one comparable scale, not a brochure number.

Send your question and a counsellor will call you back about batch timings, fees, EMI options, placement record, or whether this course fits your degree.
One call with a counsellor is usually enough to find out. Book a free demo class and see the lab before you decide.