
6 Month Power BI & Data Analytics Course in Phagwara
Join the 6 Month Power BI & Data Analytics Course in Phagwara. Learn Excel, Power BI, DAX, dashboards and practical data analysis.

Build job-ready data analytics skills with the 6 Month Power BI & Data Analytics Course at techcadd , Phagwara. This practical training programme is designed for students, graduates, job seekers and working professionals who want to learn how to collect, organise, analyse and visualise data for better business decisions.
In today's data-driven business environment, organisations depend on accurate reports, interactive dashboards and meaningful insights to improve performance. This course helps you develop the technical knowledge and practical skills required to work with business data using Microsoft Excel, Power BI and other essential data analytics tools.
Learn Data Analytics from Basics to Advanced
The programme starts with the fundamentals of data handling and gradually moves towards advanced analytics and business intelligence. You will learn how to manage datasets, clean and transform information, perform calculations, create visual reports and present findings professionally.
Key Skills You Will Learn
Microsoft Excel: Formulas, functions, sorting, filtering, lookup functions, Pivot Tables and advanced spreadsheet management.
Advanced Excel: Data cleaning, analysis, reporting and automated calculations.
Power BI: Data importing, Power Query, data modelling, relationships and interactive dashboards.
DAX: Calculated columns, measures, essential functions and business calculations.
Data Visualisation: Charts, graphs, KPI cards, slicers and professional dashboard design.
SQL Fundamentals: Database concepts, queries, filtering and retrieving information.
Data Analysis: Understanding trends, identifying patterns and interpreting business information.
Business Intelligence: Converting raw data into meaningful reports that support decision-making.
Practical Training and Real-World Projects
At techcadd , the focus is on learning by doing. You will practise with sample datasets and business-oriented assignments to understand how data analytics is used in real working environments.
During the programme, you can work on projects such as:
Sales Performance Dashboard
Financial Analysis and Reporting
Employee Performance Dashboard
Business Growth Analysis
Customer Data Analysis
Inventory and Stock Reports
Who Can Join This Course?
This course is suitable for:
BCA, MCA, B.Tech and computer science students.
B.Com, BBA and commerce students.
Graduates looking for data-related career opportunities.
Working professionals who want to improve reporting skills.
Beginners interested in Power BI and data analytics.
No advanced programming background is required to begin. Training starts with the fundamentals and progresses step by step.
Career Opportunities After the Course
After completing the training and developing practical project experience, you can explore opportunities such as:
Junior Data Analyst
Power BI Developer (Entry-Level)
MIS Executive
Business Intelligence Analyst (Entry-Level)
Reporting Analyst
Excel Analyst
Data Reporting Executive
Why Choose techcadd, Phagwara?
Six-month structured training programme.
Practical, hands-on learning approach.
Industry-oriented datasets and assignments.
Training in Excel, Power BI and data analytics.
Dashboard development and reporting practice.
Project-based learning.
Guidance for building a professional portfolio.
Start Your Data Analytics Journey
Turn raw data into meaningful insights and develop skills that businesses value. Join the 6 Month Power BI & Data Analytics Course in Phagwara at techcadd and take your first step towards a career in data analytics and business intelligence.
Power BI & Data Analytics – Learn Through Practical Projects
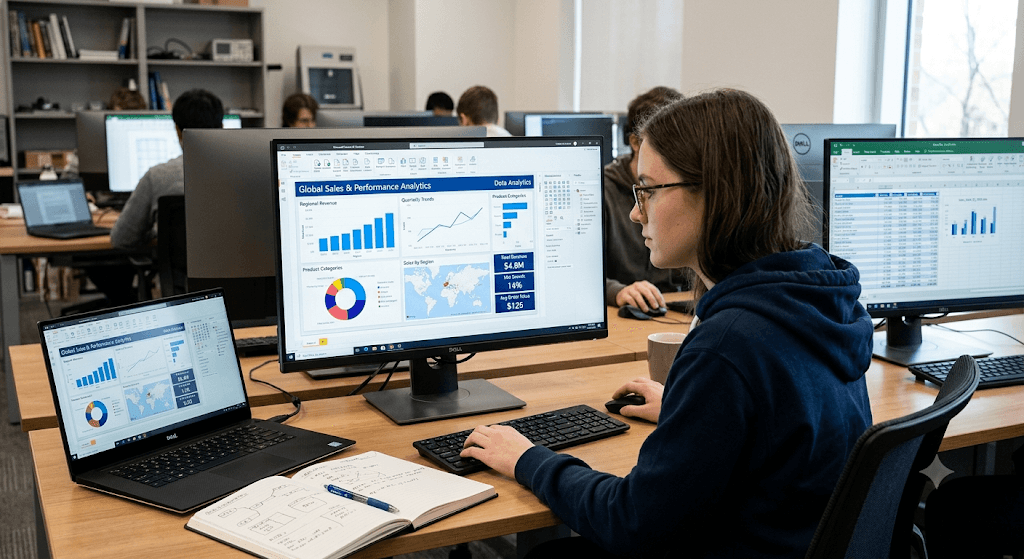
Master Data Analytics with Practical Power BI Training
Turn Raw Data into Meaningful Business Insights
Data analytics is an essential skill for modern businesses. Our 6 Month Power BI & Data Analytics Course at techcadd , Phagwara, is designed to help students develop practical skills in collecting, cleaning, analysing and presenting data.
Learn how to work with Microsoft Excel, Power BI, data visualisation, interactive dashboards and business reports. Understand how organisations use data to identify trends, monitor performance and make better business decisions.
What You Will Learn
Microsoft Excel for data management and reporting
Data cleaning and data transformation
Power Query for preparing datasets
Power BI Desktop fundamentals
Data modelling and relationships
DAX basics and calculated measures
Interactive dashboards and visualisations
Business Intelligence and MIS reporting
Real-world data analysis projects
Dashboard design and report presentation
Practical Learning Approach
Work with practical datasets, create interactive dashboards, analyse business performance and develop projects that demonstrate your analytical and reporting skills.
Who Can Join?
Students, graduates, job seekers, working professionals and beginners interested in building careers in data analytics, business intelligence and reporting.