
6 Month Data Analytics Industrial Training in Phagwara
Join 6 month data analytics industrial training in Phagwara at techcadd. Learn Excel, SQL, Power BI, Python, data visualisation and practical projects.
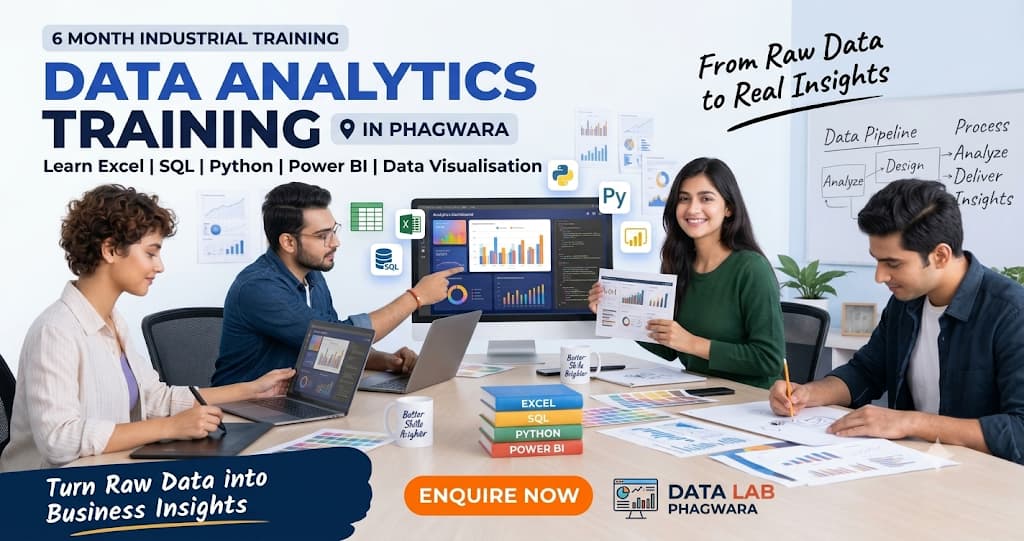
Introduction to Data Analytics
Data Analytics is an important field that helps businesses understand information, identify patterns and make better decisions. Organisations collect large amounts of data from customers, websites, sales, financial records and business operations. Data analytics helps convert this information into meaningful insights.
The 6 Month Industrial Training in Data Analytics in Phagwara is designed for students, graduates, beginners and job seekers who want to build a career in data analysis. This programme focuses on developing practical knowledge of data collection, data cleaning, data processing, visualisation and reporting.
At techcadd, students learn how to work with different data analytics tools and understand how businesses use data to solve problems. The training combines software learning, practical assignments and project-based activities to improve technical knowledge and analytical thinking.
Understanding Data Analytics Fundamentals
Students begin with the fundamentals of data analytics and learn how raw data is collected, organised, processed and analysed.
They understand different types of data, data formats, datasets, data accuracy and basic statistical concepts. Students also learn how analytical thinking helps identify business problems and discover useful information from large datasets.
Advanced Excel for Data Analysis
Microsoft Excel is one of the most commonly used tools for analysing and managing business data.
During the training, students learn important Excel functions, formulas, sorting, filtering, conditional formatting, Pivot Tables, charts and data validation.
They also practise using functions such as IF, SUMIF, COUNTIF, VLOOKUP, XLOOKUP and INDEX-MATCH to organise and analyse information.
SQL for Database Management
SQL is used to retrieve, manage and analyse information stored in databases.
Students learn database fundamentals, tables, records, data types and SQL commands. They practise SELECT, INSERT, UPDATE, DELETE, WHERE, ORDER BY, GROUP BY and JOIN operations.
This training helps learners understand how to extract useful information from structured databases.
Power BI and Data Visualisation
Power BI is an important business intelligence tool used to create interactive dashboards and reports.
Students learn how to import datasets, clean data, create relationships, use basic DAX formulas and design visual reports.
They also understand how charts, graphs, tables and dashboards help businesses monitor performance and make informed decisions.
Python for Data Analytics
Python is widely used for data analysis, automation and data processing.
Students are introduced to Python fundamentals, variables, data types, loops, functions and libraries used in analytics.
They explore libraries such as Pandas, NumPy and Matplotlib to understand data cleaning, manipulation and visualisation.
Data Cleaning and Data Processing
Data cleaning is an important step before performing any analysis. Incorrect, duplicate or missing information can affect the accuracy of results.
Students learn how to identify missing values, remove duplicate records, correct data formats and organise datasets for analysis.
These techniques help learners prepare reliable data for reporting and business decision-making.
Practical Data Analytics Projects
Practical projects help students apply their knowledge to real-world business situations. Students work with sample datasets related to sales, finance, customer behaviour and business performance.
They practise preparing reports, analysing trends, creating dashboards and presenting useful findings.
At techcadd, project-based learning helps students understand how different analytics tools work together in professional environments.
Career Opportunities After Industrial Training
After completing six months of data analytics industrial training, students can explore different career opportunities depending on their skills and project experience.
Junior Data Analyst
Data Analytics Executive
MIS Executive
Business Intelligence Assistant
Reporting Analyst
Excel Data Analyst
Power BI Developer – Entry Level
Junior Business Analyst
The training also provides a foundation for further learning in business intelligence, data science and advanced analytics.
Why Choose techcadd for Data Analytics Industrial Training?
Choosing the right training institute is important for developing practical technical knowledge. At techcadd, students learn data analytics through software practice, guided assignments and project-based activities.
The six-month programme covers Excel, SQL, Power BI, Python and data visualisation. Students get opportunities to work with different datasets, prepare reports and create dashboards.
The focus is on developing analytical thinking, problem-solving abilities and confidence in using data analytics tools.

Data Analytics Fundamentals
Understand the basic concepts of data analytics, types of data, data collection, data processing and analytical thinking.
Advanced Microsoft Excel
Learn formulas, functions, Pivot Tables, data filtering, conditional formatting, charts and advanced spreadsheet techniques.
SQL and Database Management
Understand database concepts and practise SQL queries, filtering, sorting, grouping and joining tables.
Power BI Training
Learn data importing, Power Query, data modelling, DAX fundamentals, interactive dashboards and business reports.
Python for Data Analytics
Understand Python programming basics and explore Pandas, NumPy and Matplotlib for data analysis and visualisation.
Data Cleaning and Preparation
Learn how to handle missing values, remove duplicate records, correct errors and prepare datasets for accurate analysis.
Data Visualisation Techniques
Understand how to present complex information through charts, graphs, dashboards and interactive reports.
Statistical Analysis Fundamentals
Learn basic statistics, averages, percentages, distributions, comparisons and trend analysis for interpreting datasets.
Business Intelligence and Reporting
Understand how businesses use data reports and dashboards to monitor performance and support decision-making.
Practical Industrial Projects
Work on sales analysis, customer data analysis, financial reports, Excel assignments and Power BI dashboard projects.